
In the fast-moving world of trading — whether crypto, forex, stocks or commodities — many traders chase flashy indicators, signals and secrets. However, the most durable edge isn’t found in the latest algorithm or fancy indicator: it lies in reading price action. This means understanding what the market is doing right now via its raw price movements.
At TradingNova our mission is pure: no hype, no buy/sell calls — just education. In this comprehensive guide you will learn how professional traders interpret price action, the logic behind important structures, how to apply it using your time-frames, and how this underpins the frameworks you already use (such as Fibonacci levels). You’ll walk away with a mindset and toolkit for clarity, not noise.
What Is Price Action?
Price action is a methodology where all trading decisions are made from the price chart itself — the ‘raw’ display of open, high, low and close data — rather than relying on lagging indicators, news feeds or guesswork.
It’s sometimes called “clean-chart trading” or trading “naked price” because the focus is purely on price, not on derived calculations. Price action trading assumes that everything that influences the market — fundamentals, sentiment, macro-news — is already embedded in the price itself, and thus you read the chart to understand participants’ behaviour.
Why Price Action Matters
- Direct clarity: You interpret the market based on what is, not what could be.
- Universality: Price action applies across timeframes (1 min, 5 min, 1 h, daily) and assets.
- Adaptability: Rather than relying on fixed indicator formulas, price action evolves with the market.
- Foundation for structure: Reading price action builds your ability to identify break of structure (BOS), liquidity sweeps, support/resistance, and trend dynamics.
Core Elements of Price Action
To read price action like a professional, you must understand a few foundational concepts that recur on charts.
Market Structure — Trend vs Range
Markets broadly exist in two states: trending or ranging. Recognising which one you’re in is essential.
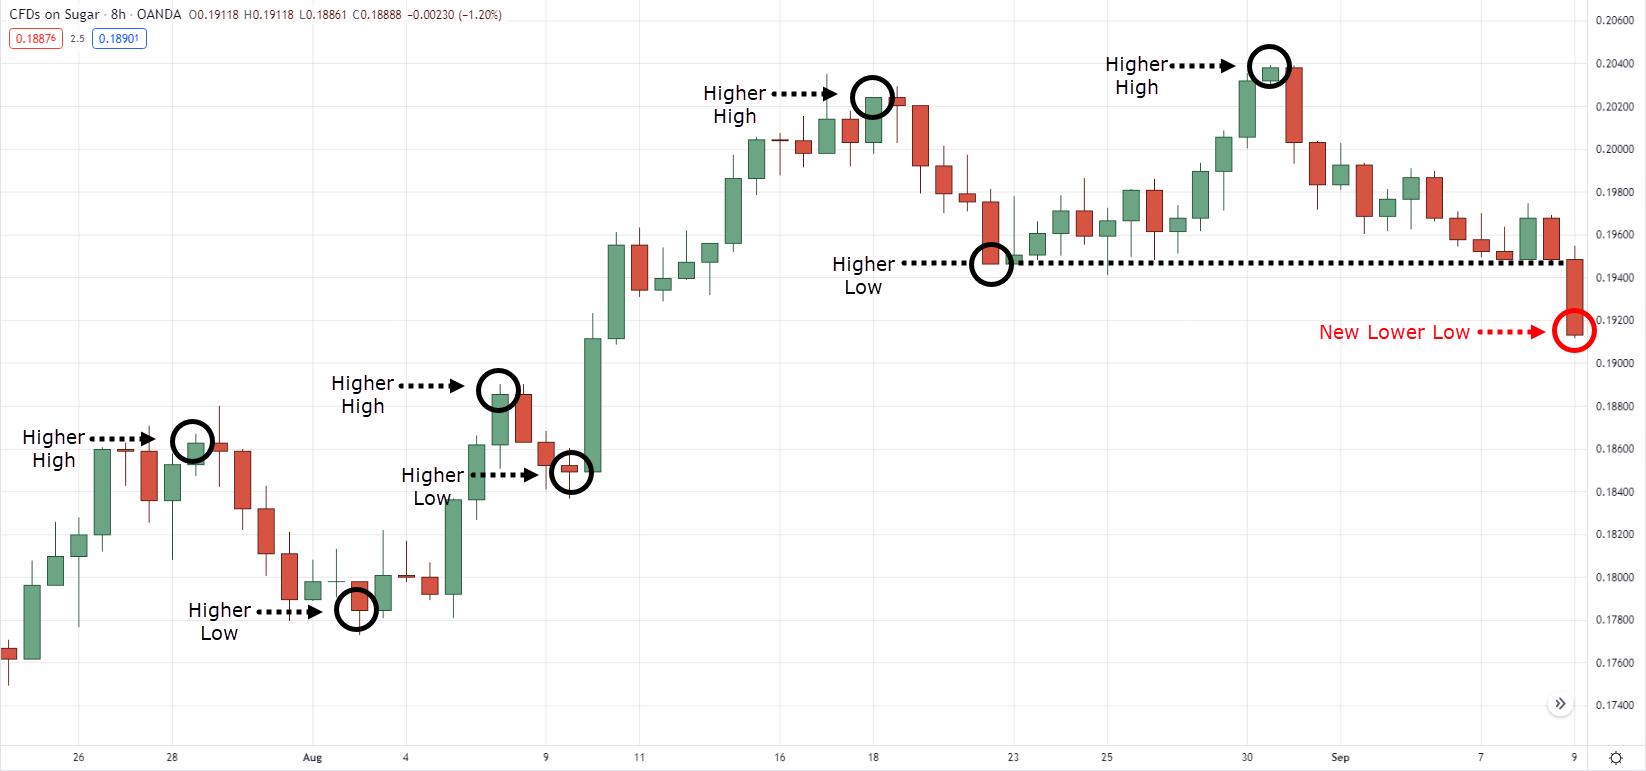
- Trending market: characterised by a sequence of higher highs (HH) and higher lows (HL) in an up-trend, or lower highs (LH) and lower lows (LL) in a down-trend.
- Ranging market: price oscillates between support and resistance, without clear directional structure.
Swings, Highs & Lows
The market moves in swings — legs of movement followed by retracements. Recognising the swing highs/lows helps you locate structure points.
- A prior swing high may act as resistance; a prior swing low may act as support.
- When a swing low is broken (in an up-trend) this signals a potential shift.
- Professional traders monitor these swings to determine bias rather than relying on indicators.
Support & Resistance
Support and resistance zones form natural decision areas where price reacts. They are critical to reading price action.
- Support: price area where demand begins to outweigh supply, slowing or reversing a down-move.
- Resistance: price area where supply begins to outweigh demand, slowing or reversing an up-move.
- The role of a zone can flip — prior resistance becomes support after a breakout, and vice versa.
Liquidity & Traps
Professional traders often look beyond simple structures to liquidity zones — areas where traders’ stop-losses cluster, or where price may sweep before moving.
- Liquidity sweeps: these occur when price moves beyond a visible high/low to capture trapped orders, then reverses.
- By reading price action, you identify when price is probing for liquidity before turning or accelerating.
Price Action Patterns & Candlesticks
While price action isn’t about memorising every named candlestick, patterns like pin bars, engulfing bars, inside bars and fakeys do provide readable clues.
- A pin bar shows rejection of one side (long tail) and often signals a turn.
- An inside bar shows consolidation and can lead to a breakout.
- A fakey pattern is a false breakout that traps traders and reverses.
Reading Price Action Step-by-Step
Here’s how a professional trader approaches a chart using price action, systematically.
1. Start with a Clean Chart
Remove all or most indicators. Professionals prefer to view price with minimal distractions, then add context only when necessary. This reveals the pure information of price.
Remove clutter, keep timeframes clean (for instance, 1 h + 15 min) and focus on bars/candles, highs/lows and structure.
2. Identify the Higher-Timeframe Bias
Use a higher timeframe (e.g., 1 h) to determine the dominant structure — trend vs range, recent swings, key supply/demand zones.
Ask: Are we in a clear up-trend, down-trend or sideways?
Mark major swing highs & lows, and significant structure breaks.
3. Inspect the Intermediate Timeframe
Switch to a lower timeframe (e.g., 15 min) and look for confluence:
- Price nearing the higher timeframe structure zone (support/resistance).
- Price showing signs of reaction (retests, range contraction, price rejection bars).
This is where entries/precision begin to emerge.
4. Confirm with Price Action Readings
Look for:
- Price failing to make a new higher high (in an uptrend) → alert for shift.
- Liquidity sweep: price moves beyond prior high but closes back inside → indication of bullish stop-hunting.
- Rejection bars: long shadows, small bodies, closing opposite direction.
- Range behaviour turning into breakout or trend continuation.
5. Align with Execution Logic
While we are not discussing buy/sell signals, professional traders use price action to align entries and manage risk:
- Deeper pullbacks toward structure offer lower-risk precision zones.
- Shallow pullbacks in strong trends denote momentum continuation.
- Use price action context (rejecting tails, inside bars at key zones) rather than chasing momentum blindly.
6. Integrate with Fibonacci & Confluence
At TradingNova we emphasise how price action and Fibonacci levels work hand-in-hand.
For example: when a 61.8 % Fibonacci retracement level coincides with a swing low and price shows a rejection bar — that area becomes high-confluence.
Reading how price behaves at these retracement/extension levels (wicks, closes, retests) is core to professional price action.
Example: Applying Price Action in a Trend
Let’s walk through a scenario (educational only — no trading signals).
- On the 1 h chart you identify an up-trend: HH → HL → HH.
- A recent swing low at 1 234 (for example) served as support.
- You draw a Fibonacci retracement from the prior swing low to the most recent swing high. The 61.8 % level lands at 1 260, which also aligns with the swing low support.
- On the 15-min chart, price retraces into the 1 260 zone, forms a long-lower-wick candle (rejection bar), and closes inside the zone rather than decisively broken.
- Price action here suggests participation and orderflow is stepping in — though you are not executing a trade, you observe the logic.
- If price begins to form higher highs on the 15-min and retests with rejection, you note a possible continuation — this is professional reading of price action + Fibonacci confluence.
Common Mistakes When Reading Price Action
Relying on Indicators Instead of Price
Many traders clutter charts with multiple indicators and lose the signal. Price action often gets masked. Clean charts = clear reading.
Ignoring Context
A pattern alone is not meaningful without context. For example, a pin bar in a strong trend vs inside a range have very different implications. Always ask: Where is the price in structure?
Forcing Patterns
Don’t look for the “signal” and force a pattern. Price action must meet criteria of context plus behaviour. Else it becomes guesswork.
Neglecting Multi-Timeframe Structure
Seeing an inside bar on a lower timeframe but ignoring the higher timeframe structure often leads to false moves. Professionals work top-down and bottom-up.
Forgetting Risk & Probabilities
Reading price action gives you an edge, not a guarantee. Risk management remains paramount. No reading of price eliminates risk.
How to Build Your Price Action Reading Skill
Chart time daily
Dedicate time each day to review recent price action— mark swings, structures, retests.
Maintain a trading journal
Record your observations: what price did, how it behaved at zones, how you read it (without making trades).
Review past setups
Go back 3–6 months on charts and try to explain price behaviour: where structure broke, where liquidity was swept, what pattern followed.
Use incremental goals
Start by identifying trend vs range, then move to swing highs/lows, then to reaction at zones, then to precise candlestick behaviour.
Keep it simple
Stick to clean charts, focus on price and structure. Avoid indicators until structure reading is mastered.
Integrating Price Action With Fibonacci and Confluence
One of the distinguishing strengths of the TradingNova framework is merging price action reading with Fibonacci levels to create high-probability zones.
Why this integration matters
- Fibonacci retracements/extensions mark likely zones of price reaction (retracement levels, expansion targets).
- Price action reading determines how price behaves at those levels. Are there rejects? Is there prolongation?
- Professional traders don’t treat Fibonacci as magic numbers; they treat them as zones to watch behaviour.
Example zone setup
- On the 1 h chart, draw Fibonacci from swing low to swing high.
- The 50 % and 61.8 % levels coincide with a prior swing low (structure) and a liquidity cluster (stop-loss area).
- Price retraces to this zone, on 15 min forms an inside bar then a rejection bar with strong upper wick.
- This zone therefore qualifies as price action + Fibonacci confluence — a high-quality observation point.
What to observe
- Does price close within the Fibonacci zone or reject it immediately?
- Does price retest the zone and show still rejection?
- Does price form a break of structure after the zone holds?
These price behaviours are what define professional reading, not just marking the level and hoping.
Advanced Price Action Concepts for the Professional Trader
Break of Structure (BOS) & Change of Character (ChoCh)
- Break of Structure (BOS): when the prior swing low (in an uptrend) or swing high (in a downtrend) is broken, signalling a potential structural shift.
- Change of Character (ChoCh): a shift in market behaviour (for example, from trending to range, or from accumulation to distribution). Recognising ChoCh early makes price action reading powerful.
Liquidity Pools & Sweeps
Professional traders identify hidden liquidity — often beyond visible highs or lows where many retail stop-loss orders lie. Price action at these zones may show a quick spike beyond the level, then smooth reversal. Recognising this trap behaviour is key.
Orderflow Clues (via Price Action)
While full orderflow tools may require advanced platforms, you can still read orderflow via price action:
- Large wick followed by a strong close in opposite direction = absorption.
- Tight range before breakout = accumulation.
- Speed + size of bars = momentum shift.
Confluence Across Timeframes
Professional reading often involves aligning 1 h, 15 min, and 5 min timeframes:
- Structure on 1 h gives bias.
- Reaction on 15 min gives precision.
- Price action on 5 min gives entries/confirmation.
The key is reading price action in context across multiple timeframes, not isolated.
Putting It All Together — What It Looks Like
Let’s summarise what professional price action reading looks like:
- On the 1 h chart you see the market has shifted from range to uptrend via a BOS (prior swing high broken).
- You mark the prior swing low and draw Fibonacci retracement from that swing low to recent swing high.
- On the 15 min chart, price retraces into the 61.8 % Fibonacci zone which also coincides with the prior swing low (structure).
- You observe the price forms a long-lower-wick candle, closes inside the zone, and does not make a lower low.
- You recognise the behaviour: structure holds, liquidity may be absorbed, price rejects the zone.
- The reading: price is likely to resume trend. You note this observation (not a signal) as a professional reading of price action.
- On the 5 min chart you watch for confirmation: perhaps an inside bar followed by a breakout.
- Because you read price action correctly, you understand why this zone matters and position yourself mentally to monitor it, rather than guess blindly.
Summary & Key Takeaways
- Price action is the most direct way to read what the market is doing — via its own price moves.
- Clean charts and emphasis on structure, swings, liquidity and price behaviour give you an edge.
- Identify trend vs range, mark swing highs/lows, locate support/resistance and liquidity zones.
- Patterns (pin bars, inside bars, fakeys) matter — but only in context, not in isolation.
- Combine price action reading with your existing tools (like Fibonacci) for high-confluence setups.
- Professional reading spans multiple timeframes and avoids indicator clutter.
- The skill of reading price action comes from practice, reviewing past charts, journaling, and building your “market context awareness.”
- Always remember: reading price action gives you probabilities, not certainties. Risk and discipline remain foundational.
FAQ
Q1: Can I trade using only price action without indicators?
Yes — many professional traders operate with minimal or no indicators. The core logic is to interpret price, structure and behaviour. Indicators may lag and clutter charts.
Q2: Which timeframes are best for reading price action?
You can apply price action across any timeframe. For precision and context, professionals often use a higher timeframe (e.g., 1 h) for bias and a lower timeframe (e.g., 15 min) for reaction. Others may use 5 min for entries.
Q3: How does Fibonacci integrate with price action reading?
Fibonacci retracement and extension levels mark probable areas of reaction. Reading how price behaves at these levels (rejects, closes inside, retests) gives you a confluence of structure + price action logic.
Q4: What are the most common mistakes when reading price action?
- Using indicators instead of reading price.
- Ignoring context (structure, timeframe) and chasing patterns.
- Forcing setups that don’t meet logical criteria.
- Neglecting multi-timeframe analysis.
Q5: How do I know when price action reading is working?
Monitor your observations over time — see how price reacts at marked zones, review past charts, keep a journal of your readings and compare with actual price moves. Skill grows with repetition and clarity.
Q6: Does price action guarantee profits?
No. Price action offers an edge — a higher probability — but not guarantees. You still need risk management, good sizing, discipline and patience.
`